Hydroelectric Power and the Environment: How to create a sustainable hydroelectric plant in the 21st century using simulation

Hydroelectric power plants offer many advantages as a renewable source of electricity but can pose a risk to the environment if not operated correctly. When a U.S. based utility company found their hydroelectric power plant was at risk of threatening the environment due to spillage, they needed an immediate solution without disrupting traditional plant operation and operating efficiency. With the help of Modelon, engineers began an effort to retrofit the controls to manage reservoir water levels and mitigate spillage using a modern model-based control system development approach.
Building a Model of the Hydroelectric Plant
In order to build the control system, the company first needed a model of its hydroelectric plant. Using the Modelon Hydro Power Library (HPL) , a virtual model of the hydroelectric plant was created including the following:
- Intake Gate
- Flume and Spillways
- Reservoirs
- Penstock with Valve
While HPL contained all necessary components as an out-of-the-box solution, specific components were customized to allow for more flexible and accurate modeling based on available data from the plant. With little or no flowrate data available for the plant, the model was built using the physical components in the library with adjustable coefficients as needed.
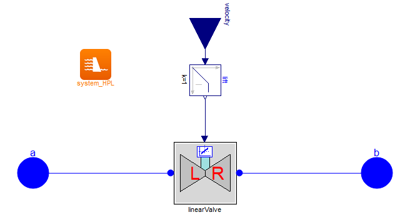
Intake Gate
The intake gate is modeled as a linear valve with the gate velocity as an input (Figure 1). The valve is characterized based on an estimate of the gate position at maximum flow.
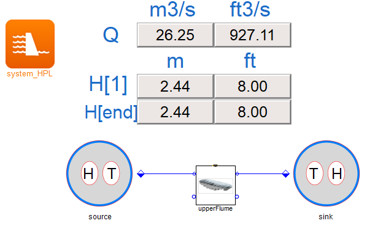
Flumes and Spillways
The upper and lower flumes as well as the spillway were modeled as reservoirs with varying elevation. A custom friction model was also implemented and integrated into the reservoir model. Since the focus of the controls development was the avoidance of spill, it was important that the flume system flowed correctly at different depths. To ensure this critical system characteristic, operator setpoint data was used for the upper flume depth as a function of flowrate. A unit test model of the upper flume was used to calibrate the roughness coefficient for the friction model.
Reservoir
The reservoir for the basin and forebay are based on the open volume component in the Modelon HPL. However, since the reservoirs in the actual flume system were an irregular shape due to topological variations of the geography, a custom component was created for the reservoirs in the flume system.
Penstock with Valve
The system model includes a dynamic model of the forebay and the penstock with a specified downstream pressure at the outlet. Based on the location of the penstock connection to the forebay, hydrostatic pressure drives the flow in the penstock. The penstock valve is a linear valve that is characterized to deliver the maximum plant flow at a flow command of 1.
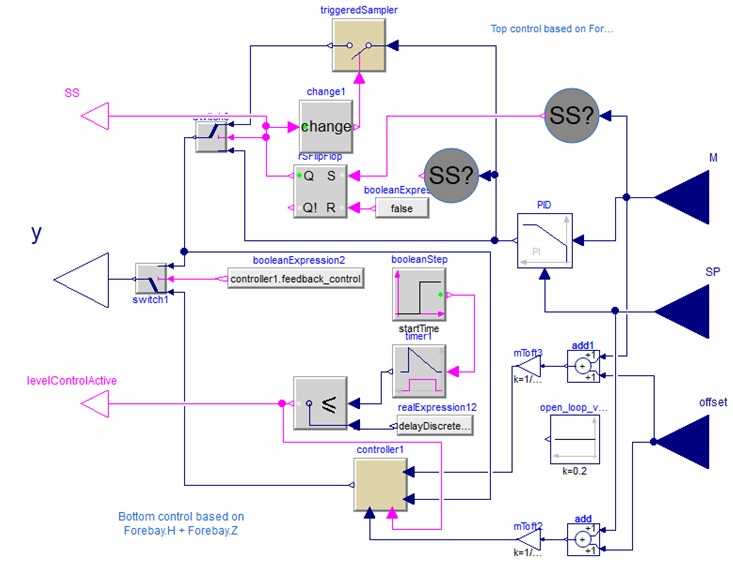
Control System Design
To evaluate the proposed control algorithm, Modelon designed a control system for integration with the plant. The penstock control system included the following operating modes (see Figure 4):
- Open-loop
- Continuous control
- Steady-state detection
This controller allows the system to be simulated in both normal and emergency modes including a realistic specification of the driving elements for the system response, such as the maximum gate opening velocity, in a manner similar to the actual plant.
Control System Testing
To verify the control system, a virtual test plan was developed to prove out the physical model and calibrate the proprietary control algorithm. The test plan included level setpoint step tests, varying oscillation tests, and max flow step tests.
Control System Commissioning
After the control system was verified using the model, the controller was commissioned on the plant. A comprehensive test plan was established to ensure signal integrity, controller response, and actuator bandwidth and response over a wide range of operating conditions. Figure 6 shows one of the results from a max flow test from the virtual validation testing conducted prior to commissioning. This test is one of the most severe for the system and showed that the control scheme was able to manage the water level and avoid spillage.
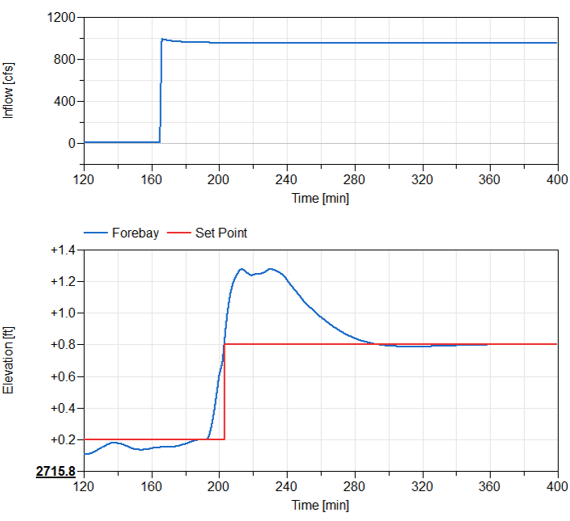
Figure 7 shows results from a max flow test during the commissioning. The commissioning data is provided at 5-minute intervals, where the intake setpoint is representative of the intake system flow. Note that this test is not identical to the one conducted in the virtual validation as boundary conditions could not be controlled in exactly the same way but is close enough for qualitative comparison of the system response between the model and the actual system.
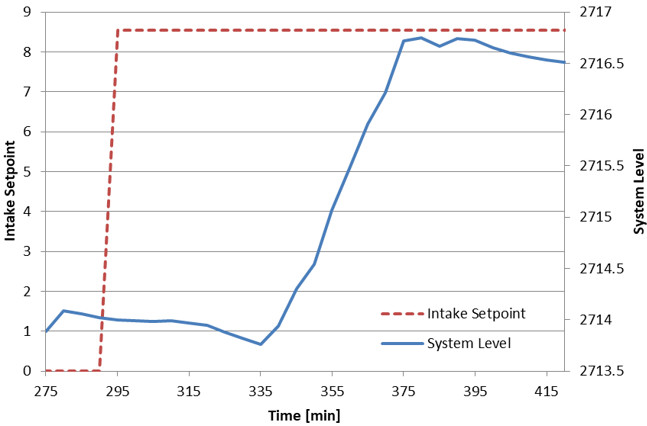
Tests concluded that the model-based calibration developed during analytic work was successfully validated – efficiently managing spillage risk.
Summary
With the assistance of Modelon, the U.S. based energy company successfully designed, tested, and implemented a control system that minimized the environmental impact of their hydroelectric power plant. Through this work, a few different best practices to improve future model-based controls development processes were identified:
- Simulating not just the overall system response but also any dynamics in the sensor system provides better input signals for the model-based calibration. This step can reduce work for a more robust virtual calibration process. Flow data is important to have when building the model as it allows verification of the system response early in the development process.
- Steady state initialization of the system model would have reduced the time spent waiting for the system to reach steady state and would simplify the extra logic in the controller to control test conditions.
This study was published for the 2019 International Modelica Conference. Interested in reading the full paper? Click here.